The 2019 Feast of Sacrifice holiday, also known as Eid al-Adha, is set to see a boom in outbound travel from the Gulf Cooperation Council (GCC) countries.
Currently, forward bookings for this year’s holiday period from July 30 to August 12 are 10 per cent ahead of last year’s holiday period from August 8 to 21, according to a report from ForwardKeys, which analyses over 17 million flight bookings a day.
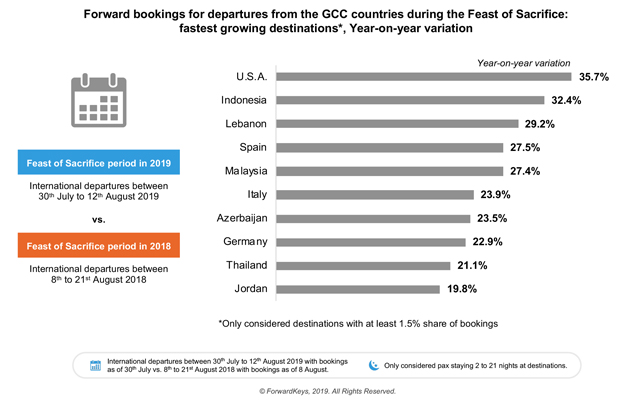
Thailand, Indonesia and Malaysia to reap outbound travel boom from Feast of Sacrifice holiday
As a result of this outbound boom, countries in the Southeast-Asia region; namely, Indonesia, Malaysia and Thailand, are also set to reap the growth benefits from this major source market.
The top 10 destinations in order of size are: Turkey, Egypt, India, the UK, the UAE, Thailand, Germany, Pakistan, France and Lebanon.
When it comes to destination market growth, the US heads the list, with bookings for the holiday period this year (July 30 to August 12) 35.7 per cent ahead of the holiday period last year (August 8 to 25). It is followed by Indonesia, 32.4 per cent ahead; Lebanon, 29.2 per cent ahead; Spain, 27.5 per cent ahead; Malaysia, 27.4 per cent ahead; Italy, 23.9 per cent ahead; Azerbaijan, 23.5 per cent ahead; Germany, 22.9 per cent ahead; Thailand 21.1 per cent ahead and Jordan 19.8 per cent ahead.
As for origin market growth, the UAE heads the list, with outbound bookings for the holiday period this year 19.7 per cent ahead of the holiday period last year. It is followed by Qatar, 14.6 per cent ahead; Kuwait, 13.9 per cent ahead; Bahrain, 4.7 per cent ahead and Saudi Arabia, 4.4 per cent ahead. Outbound bookings from Oman were 7.2 per cent behind.
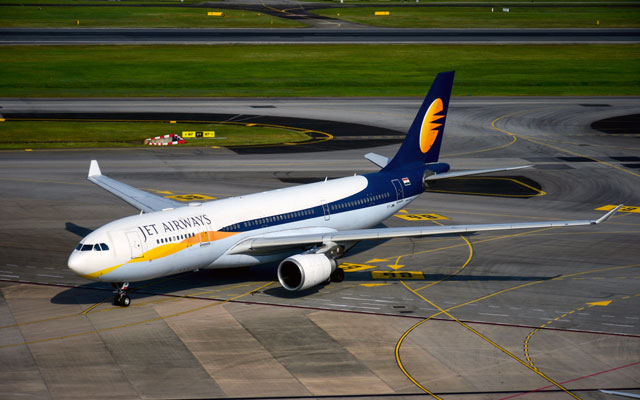
Luis Millan, market research manager, ForwardKeys, said: “This is a real good news story. With the exception of Oman, all the major outbound markets are showing healthy growth and the same is true for the destinations. The one exception is India. It has suffered from the collapse of Jet Airways; however, various LCCs have increased their seating capacity to meet the likely additional demand.”
Global air connectivity continues to become more accessible and more efficient, having flown 4.4 billion passengers last year, according to 2018 performance figures released by IATA in its latest edition of the World Air Transport Statistics.
Record efficiency was achieved with 81.9 per cent of available seats being filled, while fuel efficiency improved by more than 12 per cent compared to 2010. The report also revealed that 22,000 city pairs are now connected by direct flights, up 1,300 over 2017 and double the 10,250 city pairs connected in 1998. The real cost of air transport has more than halved over the last 20 years (to around 78 US cents per revenue tonne-kilometre, or RTK).
A whopping 4.4 billion people travelled by air in 2018
“Airlines are connecting more people and places than ever before. The freedom to fly is more accessible than ever. And our world is a more prosperous place as a result. As with any human activity, this comes with an environmental cost that airlines are committed to reducing,” said Alexandre de Juniac, IATA’s director general and CEO.
He added: “We understand that sustainability is essential to our license to spread aviation’s benefits. From 2020, we will cap net carbon emissions growth. And, by 2050, we will cut our net carbon footprint to half 2005 levels. This ambitious climate action goal needs government support. It is critical for sustainable aviation fuels, new technology and more efficient routes to deliver the greener future we are aiming for.”
Other highlights of the 2018 airline industry performance from the report include:
System-wide, airlines carried 4.4 billion passengers on scheduled services, an increase of 6.9 per cent over 2017, representing an additional 284 million trips by air. Meanwhile, the development of the LCC segment continues to outpace that of network carriers. Measured in ASKs (available seat kilometres), LCC capacity grew by 13.4 per cent, almost doubling the overall industry growth rate of 6.9 per cent. LCCs accounted for 21 per cent of global capacity in 2018, up from 11 per cent in 2004. When looking at available seats, the global share of LCCs in 2018 was 29 per cent, reflecting the short-haul nature of their business model. This is up from 16 per cent in 2004. Some 52 of IATA’s 290 current member airlines classify themselves as LCCs, and other new model airlines.
Airlines in the Asia-Pacific region once again carried the largest number of passengers systemwide. The regional rankings (based on total passengers carried on scheduled services by airlines registered in that region) are: Asia-Pacific with 37.1 per cent market share (1.6 billion passengers, up 9.2 per cent from 2017), Europe with 26.2 per cent market share (1.1 billion passengers, up 6.6 per cent from 2017), North America with 22.6 per cent market share (989.4 million passengers, up 4.8 per cent from 2017), Latin America with 6.9 per cent market share (302.2 million passengers, up 5.7 per cent from 2017), Middle East with 5.1 per cent market share (224.2 million passengers, up 4.0 per cent from 2017) and Africa with 2.1 per cent market share (92 million passengers, up 5.5 per cent from 2017).
The top five airlines ranked by total scheduled passenger kilometres flown, were: American Airlines (330.6 billion), Delta Air Lines (330 billion), United Airlines (329.6 billion), Emirates (302.3 billion) and Southwest Airlines (214.6 billion).
The top five international/regional passenger airport-pairs were all within the Asia-Pacific region again this year: Hong Kong – Taipei Taoyuan (5.4 million, down 0.4 per cent from 2017), Bangkok Suvarnabhumi – Hong Kong (3.4 million, up 8.8 per cent from 2017), Jakarta Soekarno-Hatta – Singapore Changi (3.2 million, down 3.3 per cent from 2017), Seoul-Incheon – Osaka-Kansai (2.9 million, up 16.5 per cent from 2017) and Kuala Lumpur–International – Singapore Changi (2.8 million, up 2.1 per cent from 2017).
The top five domestic passenger airport-pairs were also all in the Asia-Pacific region: Jeju – Seoul Gimpo (14.5 million, up 7.6 per cent from 2017), Fukuoka – Tokyo Haneda (7.6 million, up 0.9 per cent from 2017), Melbourne-Tullamarine – Sydney (7.6 million, down 2.1 per cent from 2017), Sapporo – Tokyo-Haneda (7.3 million, down 1.5 per cent from 2017) and Beijing Capital – Shanghai Hongqiao (6.4 million, up 0.4 per cent from 2017).
The top five nationalities travelling (international routes) are: the UK (126.2 million, or 8.6 per cent of all passengers), the US (111.5 million, or 7.6 per cent of all passengers), China (97 million, or 6.6 per cent of all passengers), Germany (94.3 million, or 6.4 per cent of all passengers) and France (59.8 million, or 4.1 per cent of all passengers).
Meanwhile, Star Alliance maintained its position as the largest airline alliance in 2018 with 21.9 per cent of total scheduled traffic (in RPKs), followed by SkyTeam (18.8 per cent) and oneworld (15.4 per cent).
Born and bred in the Inle Lake region of Myanmar, Yin Myo Su – affectionately known as Misuu – has devoted the past decade of her life to raising the standards around the area she calls home.
For the last 23 years, Misuu has been running a family business of hotels and resorts in the area. “I had worked in hospitality for a long time so I know how tourism can do good but also a lot of harm. Promotion and preservation go hand-in-hand,” she said.
With that realisation, she began sowing the seeds for Inle Heritage. What began as a Burmese cat reintroduction breeding programme in 2007 has today flourished into a full-fledged hospitality vocational centre geared towards helping disadvantaged youth.
As part of her sustainability efforts, Misuu also turned a traditional stilted house into a restaurant serving up her grandmother’s recipes and a garden to grow the fresh ingredients.
In order to receive organic status, Misuu had to get the soil and water tested. And while the soil passed, the water from Inle Lake didn’t. Misuu recalled: “As a child 40 years ago, I would wash myself with this water. Now in some places, it has intense chemicals from boats and other issues.”
Misuu set about collecting data and monitoring the water throughout the lake. She flew to Malaysia to visit projects there that were using natural water filtration systems, and subsequently created a cost-effective natural wetland with aquatic plants that filter grey water. This strategy was soon adopted by other villagers and communities living on the lake.
Since then, Misuu has continued building up her foundation, opening the Inle Heritage Hospitality Vocational Training Centre (IHHVTC), which enrolled its first batch of 42 students in 2013. To finance the school, she started the aforementioned restaurant, cookery classes, an art gallery, a small resort of stilted houses and a gift shop selling items made by vulnerable women.
“I wanted to provide a space for those who drop out of formal education. The high school drop-out rate is 70 per cent. Only 30 per cent of students passed their exams last year. This is a problem and there aren’t enough vocational schools to cope with this. What do we do with all of these drop-outs? I see them as raw stones and we can help shape their future,” she shared.
IHHVTC has built up a strong reputation across the country – its students intern at some of Myanmar’s leading hotels, including the Kempinski Hotel in Naypyitaw, and Belmond Governor’s Residence, The Strand Hotel and Inya Lake Hotel in Yangon.
Fresh graduates are snapped up by a waiting list of top hotels, restaurants and other hospitality-related businesses across the country. In future, Misuu hopes to expand the school and take in more students annually.
The hospitality school is also a member of the Association of Southeast Asian Social Enterprises for Training in Hospitality and Catering (ASSET-H&C), which recently scooped a PATA Grand Award for Education and Training.
The combined effects of escalating trade wars, the impact of Brexit, possible oil supply shocks, and the growing likelihood of recession are set to slow global airfares and hotel rates in 2020, according to the sixth annual Global Travel Forecast, published by the Global Business Travel Association (GBTA) and Carlson Wagonlit Travel (CWT)
After posting sharp rises in 2019, prices in the global travel industry are projected to slow in 2020, with flights rising a modest 1.2 per cent, hotels rising only 1.3 per cent, and rental car rates up one per cent.
India-based Jet Airways’ shutdown in April has inevitably led to higher airfares
While the global economy is doing well overall – and expected to grow a solid 3.6 per cent in 2020 – a raft of uncertainties are set to put a damper on pricing.
Scott Solombrino, GBTA COO and executive director, said: “Technological advancements and an increasingly volatile economic and political landscape across the globe have changed the way today’s travel buyers need to do their jobs. This annual forecast provides insights into the key drivers forcing these shifting priorities and gives a road map for travel buyers looking to plan their 2020 travel programs.”
Asia’s expansion has slowed down due to worsening US-China relations, tighter global financial conditions and natural disasters. But the region remains the most dynamic, with steady GDP growth, benign inflation and a sense of optimism, the report added.
Air
In Asia-Pacific, the shutdown of India-based Jet Airways’ operations in April created a gap in the market for some key routes, and the reduced competition has meant higher airfares. But with other airlines adding capacity to fill the vacuum, fares have begun to normalise.
Hotel
Meanwhile, Asia’s hospitality industry is booming with hotel investment volumes predicted to grow 15 per cent year-on-year. Japan will host the Rugby World Cup later this year, and the Olympic and Paralympic Games in 2020, which will boost visitor numbers to the region. The Japanese hotel market is seeing a sharp increase in supply to accommodate the anticipated surge in visitors to the country during these events.
Ground
In China, steady demand and increased competition will hurt car suppliers. Across Asia-Pacific, ride-sharing is booming, with many companies allowing their employees to use these services for business travel. Providers like Didi Chuxing, Grab, Go-Jek and Ola are pursuing aggressive expansion plans, while taking steps to put more stringent safety measures in place.
Having attracted growing interest from both overseas and Japanese large-scale investors, soaring property prices in Japan’s Niseko has led to the emergence of a new tourism storyline with numerous luxury hospitality resorts coming soon to the alpine resort destination.
Besides the soon-to-open Park Hyatt Hanazono, the incoming development pipeline includes the ultra-luxury Aman in Moiwa, Ritz-Carlton Niseko Village and Pavilions Hirafu, according to C9 Hotelworks’ new Niseko Tourism and Property Market Review.
Niseko in Japan
Research into the alpine real estate sector this past high season by C9 revealed that pre-sales of condominiums topped US$1.3 billion and house and/or land plots edged close to a quarter of a billion US dollars. One clear sign of the times is a new entry from top Singapore property group SC Global with their mixed-use Setsu project on the main street of Hirafu.
Shifting tourism demand is demonstrated in a three-year CAGR of 13 per cent for mainland Chinese, with direct flights to the gateway New Chitose airport numbering eight. Overall, the key airlift metric has seen the introduction of new international routes to Taiwan, Russia, Finland and the Philippines.
Bill Barnett, managing director of C9 Hotelworks, said: “Emerging regional buyers from Taiwan, Thailand and Malaysia reflect the new Niseko reality. Meanwhile, domestic buyers, especially from outside Hokkaido, are targeting investments in hotel branded projects and family-friendly properties. We are seeing Hirafu’s spillover demand radiate to peripheral areas including Higashiyama, Annupuri and Hanazono, while broader alpine real estate development is spreading to farther away areas such as Furano.”
He added: “Niesko has become Asia’s fastest appreciating resort real estate markets. We are seeing premium pricing levels in prime projects attain levels of US$15-20,000 per square metre. Alpine property is becoming more of an object of desire for high-net-worth Asians versus the legacy tropical pool villa asset class.”
Moving towards 2020, C9’s forecast sees larger new hotel-type projects coming into the pipeline in areas such as Hirafu, Hanazono and Moiwa. In a growing sign of market maturation, the large legacy of real estate condominium properties and stand-alone chalets looks to be challenged by bigger year-around full-service hotels.
Hotels in the Asia-Pacific region reported negative results across the three key performance metrics during 2Q2019, new market data has shown.
According to STR analysts who sample more than 65,000 hotels and 8.8 million hotel rooms around the globe, total occupancy in the region is down 1.0% to 69.1%. Meanwhile, the average daily rate (ADR) has dipped 0.7% to US$97.32, while the revenue per available room (RevPAR) has declined 1.6% to US$67.25.
Limited impact of recent events on Jakarta’s quarterly performance
Jakarta, Indonesia
STR analysts note that the Indonesian general election period in April and May protests and riots had only a limited impact on quarterly performance. Due to the Ramadan calendar shift, May was the worst-performing RevPAR month of the quarter (-17.3%), whereas June produced significant RevPAR growth (+25.3%).
Manila, Philippines
Although occupancy fell slightly due to supply growth (+4.6%), strong demand (+3.5%) helped hoteliers push room rates. According to the Philippines Department of Tourism, the country saw a 9.8% increase in international arrivals during the first five months of 2019.
Additionally, STR analysts note that the Tourism Promotions Board Philippines picked Metro Manila as a MICE location, which will help boost performance levels.
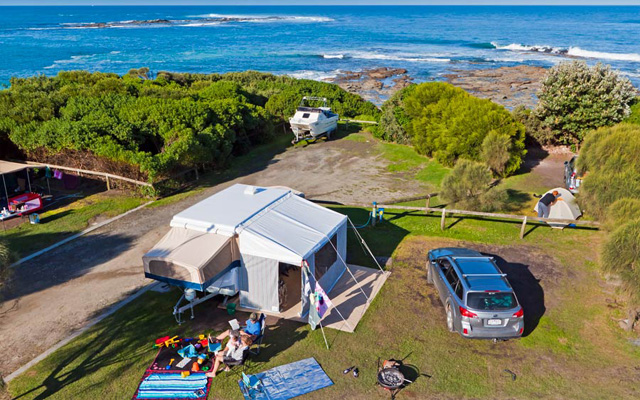
Australian holiday parks are gradually regaining control of their online sales distribution channels, and clawing back market share from large OTAs such as Booking.com and Expedia, according the first RMS Cloud Holiday Park Performance Index.
The findings were based on more than two million online bookings that were made through the RMS Cloud distribution and property management platform from 2014-2018.
Marengo Holiday Park in Apollo Bay, Australia
Holiday park operators boost direct bookings
The performance index shows between 2014-2018, the online market share of Booking.com and Expedia fell from 65% to 55% – a drop of 15%. Meanwhile, consumer direct bookings on independent holiday park websites rose by 15%, climbing from 34% in 2014 to an all-time high of 39% in 2018.
If the present trajectory continues, the index stated that direct bookings would be able to overtake OTA bookings by 2024.
Direct bookings much more profitable for operators
Cabin revenue achieved by operators through their own websites is much higher than via either Expedia or Booking.com, the RMS Cloud Holiday Park Performance Index also revealed.
Direct cabin bookings generate an average of 21% more revenue per booking than Expedia and are 10% more lucrative than Booking.com, the analysis showed.
When the 15% average commission charged by OTAs is factored in, the income differential between direct and OTA bookings can exceed 30%. It must be noted direct bookings often comes at a cost such as marketing, website development or price incentives.
Holiday park rates peaked in 2015, but it’s been mostly downhill since as operators have no pricing power outside of peak holiday periods. As a result, profits in the industry are under pressure and it’s easy to see why operators are putting a greater emphasis on direct bookings.
OTA sector a straight duopoly
Despite the progress Australian holiday parks have made over the past 18 months in reclaiming online share, the OTA duopoly of Booking.com and Expedia still have 55% of web bookings. Booking.com is the market leader, outselling Expedia 3: 1 in the holiday park market.
These two companies are famously competitive but in the Australian holiday park market, Booking.com is the clear OTA leader and pulling away.
Shifting landscape
Managing director of RMS Cloud, Peter Buttigieg, said holiday park operators are building better websites and marketing more aggressively to boost their share of online bookings and save on the commissions charged by dominant OTAs like Booking.com and Expedia.
“The landscape has shifted, and the data shows that for the first time ever, OTAs are losing market share to holiday park operators,” said Buttigieg.
“Previously it’s all been one-way traffic in the other direction, but now smart operators have lifted their online game and are fighting back, often with great success, demonstrating that given the choice and a great deal many consumers prefer to book directly with suppliers.”
Other findings
Other findings of the report revealed that holiday park stays are getting shorter while average booking lead times have increased. The average booking in 2018 was made 39 days out, up from 30 days in 2014.
Average nights per stay has also fallen 10%, from 2.1 nights to 1.9 nights. While it doesn’t sound like much, when combined with flat or declining rates, this fall has significantly impacted the average revenue per booking.
Conclusion
After many years of allowing foreign-owned OTAs Booking.com and Expedia to dominate online holiday park bookings, Australian holiday park operators are fighting back. They are investing in their websites and online presence while pushing book direct offers to consumers, cutting out the middlemen and saving on hefty commission rates.
In an era of stagnant rates, it’s their best option to maintain or increase profit, and for that reason alone it is fair to assume 2018 marks the leading edge of a longer-term trend, one that over time may eventually see direct bookings exceed those coming through the OTAs.
Overnight visitors from mainland China, South Korea, Japan and Taiwan now account for 18.5% of global travel expenditure in the world’s top 200 cities, up from just 11% a decade ago.
This is according to Mastercard’s new breakout report, Global Destination Cities Index (GDCI): Origins, which ranks where the most international travellers originate, and the most popular destinations.
The US remains the third most visited destination for travellers from mainland China; a Chinese tourist at the Grand Canyon pictured
Business and leisure travellers from the top 10 origin markets comprise nearly half (49.1%) of all overnight international visitor arrivals to the 200 destinations and 48.4% of their total expenditure.
In 2018, the global travel industry contributed a record US$8.8 trillion and 319 million jobs, and these insights help drive decision-making on how to attract international travellers and better cater to their needs.
The top 10 origin markets are, respectively, the US, China, Germany, the UK, France, South Korea, Japan, Canada, Russia and Taiwan.
“What’s most fascinating for us from an Asia-Pacific perspective is the fact that, not only has this region’s spend contribution to global travel expenditure nearly doubled in the last decade, but we’ve barely scratched the surface in terms of percentages of the populations that are traveling overseas,” said Rupert Naylor, senior vice president, data & services, Asia-Pacific, Mastercard.
“This is particularly significant in mainland China, India and Indonesia – three of the most populated places on Earth – where only 1, 0.5 and 1.7 overnight international trips were made per 100 residents to the 200 destinations in 2018, demonstrating the vast and still emerging potential of tourism and travel from these markets. This represents significant opportunities for local governments and businesses to leverage these insights to better plan and promote their travel, tourism and retail offerings.”
The figures contrast sharply with Australia where 42.7 overnight international trips per 100 residents were made to the 200 cities in 2018.
The GDCI report also revealed other encouraging findings that illustrate the region’s potential economic growth from travel and tourism:
Asia-Pacific markets comprised 40% of the top 20 origins markets in the index with Australia coming in 11th, India 12th, Indonesia 19th and Malaysia 20th.
Residents of South Korea and Taiwan are travelling overseas more than ever – breaking into and recording the biggest jumps in the top 10, moving up six and four spots respectively since 2009.
While Indonesia, the world’s fourth most populous country, ranks 19th on the origins index (with a 4.6% CAGR), its travellers rank seventh in terms of travel expenditure growth over the past decade (9.7%), demonstrating their increasing and outsized purchasing power.
Travellers from Asia are still largely choosing to visit destinations within the region which bodes well for intra-Asia growth.
Meanwhile, the US remains the third most visited destination for business and leisure travellers from mainland China, and the number one most visited by residents of Japan and Australia (when adding up the sum of visitors to all GDCI cities within each market).
Travellers around the world are increasingly paying for their travel with alternative payment methods such as e-wallets and bank transfers, more often than cards and cash combined, a new report jointly commissioned by Amadeus and cross-border payment specialist PPRO revealed.
According to The Travel Payments Guide report, this growth is occurring across the world with e-Wallets now twice as popular as cards in China, accounting for 49% of the country’s US$155 billion digital travel spend. In the US, e-wallets may replace cards as the most popular way to pay by 2025, having gained an additional 4% share of the market in the last 12 months.
Alternative payment methods such as scanning QR codes with a smartphone are becoming an increasingly convenient way to pay while travelling
Data from the report also showed that Asia leads the way in alternative payments, accounting for 58% of the region’s spend, closely followed by Europe where alternative payments represent 53% of spend. In North America, cards remain the most popular way to pay, representing 58% of all e-commerce spend, although that share has fallen from 62% just 12 months earlier.
James Booth, PPRO’s vice president – head of partnerships (EMEA), said in a statement: “Travel has always been at the forefront of e-commerce and our data shows it commands a significant share of the pie. Some of the largest markets in the world are seeing alternative, local payments take more than 7% market share in a single year so travel merchants really do need to move quickly now.”
Bart Tompkins, managing director, payments, Amadeus, commented: “This data highlights how quickly the payments landscape is changing and the increasing complexity facing travel merchants.
“It should be noted that despite less travellers paying with cards directly, many do rely on the card networks in the background. So, cards will continue to be essential payments infrastructure for our industry,” he noted.
There are now more than 300 different ways to pay for travel around the world, according to the Amadeus PPRO Travel Payments Guide which analysed e-commerce and digital travel spend across 40 of the world’s largest markets.
The report relied on a range of data sources including central banks, national e-commerce associations, IATA, PYMNTS.com and globally-recognised publicly available databases.
The recent wave of demonstrations in Hong Kong has deterred travel to the city, but the effect is short-term, according to a report from ForwardKeys.
In the four-week period from June 16 to July 13, flight bookings to Hong Kong from Asian markets fell by 5.4% on the equivalent period last year. In the first fortnight (June 16-29), bookings fell 9.0% and in the second (June 30 – July 30), 2.2%. This sharp set-back in bookings reversed a positive trend in which bookings for the first six and a half months of the year were 6.6% up on 2018.
A reporter running for cover as tear gas canisters explode during clashes with protesters outside the Central Government Office
The analysed period was marked by a two million strong demonstration accompanied by a general strike and riots on June 16, the siege of police headquarters on June 21, the storming of the Legislative Council building on July 1 and riot police charging a group of protesters with batons on July 7.
The bookings data excludes China and Taiwan, with ForwardKeys explaining that a fall in bookings from those destinations in the latter part of June could also be explained by the timing of the Dragon Boat Festival, which fell 11 days earlier this year than it did in 2018.
Olivier Ponti, vice president, insights, ForwardKeys, said: “While the numbers do not look good, things are not all bad for Hong Kong’s visitor economy. So far, the adverse media coverage of the demonstrations has not caused an overall decline in longhaul bookings to Hong Kong and the number of Asian bookings made in 2019 is still ahead of those made during the same time period in 2018 – although growth has slowed substantially since the mass protest of June 16.
“Also, it seems as if the lowest period occurred prior to the storming of the Legislative Council. However, on the less optimistic side, there were further demonstrations after our most recent numbers were run, so another downturn is possible.”